Whatever sector you work in, if you are planning on entering any Latin American market or growing here, it is very likely that you will want to see some sector numbers, including some statistical information. Based on 10+ years of supporting companies mainly from the UK, New Zealand, Ireland and the US in our region, we hope this posts helps to guide you through the usage of stats in Latin America, and given that agriculture is one of our strongest areas as consultants, we’ll give you some examples from that sector to illustrate our points. It also helps that we both have strong statistical backgrounds in the consultancy: Gaby as an economist and Matias as a market analyst.
So let’s get started.
Our first word of advice is to be very careful when using stats in Latin America for decision-making. We just lack the amount, quality, availability and depth of stats you are normally used to back home. Data here tends to be difficult to find (with some exceptions), hard to interpret, of dubious robustness, patchy (in terms of frequency and geographical coverage, for example) and, of course, only available in Spanish (or Portuguese for Brazil). For example, Matias worked as a meat market analysist for 10 years and he stresses how hard it is to find meat price stats for Bolivia, while it is very easy to find that information in Argentina, Uruguay and Brazil. Having said that, interpreting price data from Argentina is basically a nightmare, due to rampant inflation and multiple exchange rates.
As a rule of thumb, the quality and availability of stats often reflects the country’s institutional strength and transparency. So for example, data is a lot easier to find for Chile or Uruguay than for Bolivia or Paraguay. Argentina has earnt itself a reputation for “fudging” data, so expect that at all levels: inaccurate and missing data, but also a constant change in methodologies and release dates, that make longitudinal studies so complex. Peru actually messed up its Covid data big time last year, and that is, unfortunately, hardly shocking.
Solid and reliable public stats need financial and human resources. So the easiest it is for you to find data, the more developed/advanced the economy you’re researching. As we always say, the actual process of researching a market will tell you a lot about it – if it’s even hard to get the most basic of data, then you need to decide whether that is a market you really want to expand into, or at least you need to understand that you need to be prepared for that culture and that set-up.
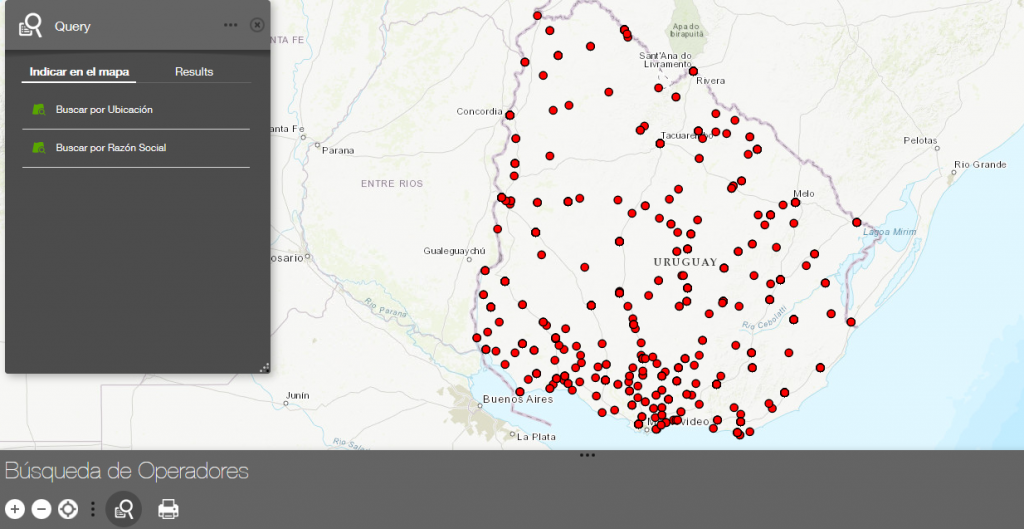
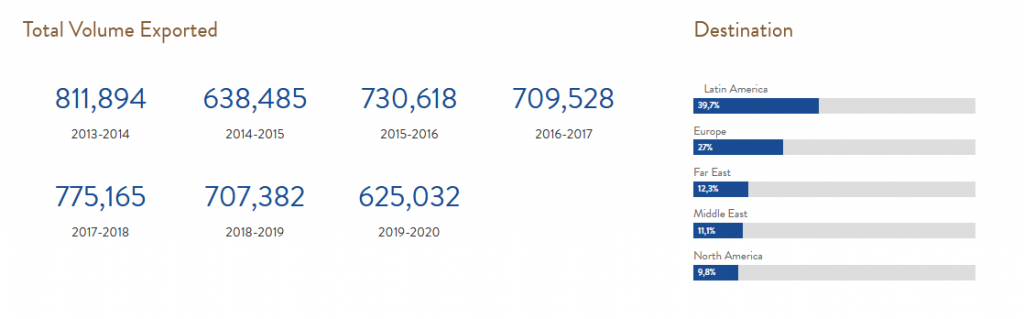
Countries, industries and companies tend to invest in stats that they care about. So a country like Uruguay, with strong cattle production, has very refined (publicly available and reliable) livestock stats, with highly-qualified teams that make it possible, and discerning regular local consumers of that data, who demand quality, consistency and depth. The same happens with fruit or wine in Chile, for example. So the more a country specialises in certain production, the more accurate and widely available the data in general. If certain production is new (like pecan nuts in Uruguay, for example), the stats behind it will tend to be poor(er).
When exploring data for market research, we often come across very out-of-date data that is totally irrelevant to our clients. Another thing to bear in mind is that you might have to ask for the data – and it’s always easier for a local who knows the sector well to know where, how and who to ask. Even a Google search requires not only certain command of Spanish/Portuguese (with some exceptions, like USDA data, for example) but knowing a bit about the sector in each country. For example, a “tambo” in Uruguay is a dairy farm, a cattle farm is an “estancia”, but official stats would talk about “establecimiento lechero” and “establecimiento ganadero” in most cases and it could get more complicated with “unidad de producción” and so on (and if the farm is for breeding, it’s a “cabaña”). The terminology is roughly the same in Argentina but quite different in Colombia, Mexico and Peru, for example. The more you know the terminology, the better the desk research. And don’t trust Google translate for this, it just doesn’t get the subtleties! Generalists don’t get it either, so if you want to go really deep into this data, you need to speak to a local specialist.
And that is mainly focusing on public sector stats. Private sector data is even harder to find, there is just no Companies House equivalent in this part of the world and even Chambers, who aggregate information, tend to only publish very high-level data and only release other data for members. So if that is a must for you, you’ll need to budget some membership fees in your research.
Then there’s the interpretation of those stats, that’s where we really add value to our clients – not because we know them inside-out, but because we always consult experts who do. It’s about questioning the data in an intelligent way and using it as a tool to guide some research with the people who really understand what’s behind it. Our ability as generalists who have worked in agriculture long enough resides in asking the right questions to the right people, the people that can make sense of those numbers. For example, in Argentina, government and industry measure maize planted area and production in different ways (government splits up grain and silage, industry “Bolsas de Cereales” don’t), so you get different numbers as a result, which could influence you decisions. A drop in production area can be due to a pest, a drought, a flood, a change in export conditions, or the competition of another crop/produce. A stat that dominates exports one year can be due to one big sell from one exporter to a certain client/market, rather than reflect the growth of a sector. Remember also to check volume v price increases/decreases, bearing in mind exchange rates, and reach the right conclusions.
If you want to know for example how receptive a sector can be to new technology that increases production, how willing it can potentially be to investing, there are many factors to take into account. To give you an example, if you looked at Argentina beef production back in 2009, you could have thought that it was the perfect time for producers to invest. However, the reality was that production was being increased because margins were very tight, and that led to a reduction in stock that in turn decreased production and investment.
Numbers can help tell stories if we question them well and long enough. Those stories can be critical to your decision-making, growth and risk-reduction. We’re passionate about making sense of stats to make it easier for you to do business in Latin America. Get in touch if we can help.